





Unsupervised Learning — Clustering
K‑means, Elbow, and Silhouette
The model that groups things without anyone telling it what to look for.
In the previous chapters, your models had a teacher: labels, classes, correct answers. Someone told them «this is fraud, this isn’t,» and they learned from that correction.
Not today.
Today we step into the territory where the model is on its own: no supervision, no hints, no solutions. Nobody tells it what anything is. And even so… it’s able to find structure in the chaos.
Welcome to unsupervised learning. And within it, to one of its biggest stars: K‑means.
The example that will follow us throughout
Before anything else, let’s set up a real case so we’re not talking in the abstract. Imagine you run an online store and you have a table with thousands of customers. For each one, you only know two things: how much they spend per month and how often they buy.
Nobody has classified them. You don’t have a column that says «this one is a VIP customer» or «this one is a bargain hunter.» You just have a cloud of points… and a hunch that there are hidden groups in there: loyal customers who spend a lot, occasional shoppers, people who only show up during the sales.
The goal of this chapter is to bring those groups into the light without anyone telling us what they are. Keep this store in mind, because we’ll use it in every section.
What is K‑means?
Picture your customers as points scattered across a plane. You don’t know what they represent, you don’t know how many groups there are, you don’t know anything. You just see a sea of data.
K‑means tries to do something very human: group together what looks alike.
It’s like walking into a party and, without thinking about it, your brain picks out the little clusters: the people chatting in the kitchen, the ones dancing, the ones who’ve taken refuge on the sofa with the dog. Nobody handed you a list. You don’t need labels. You just see patterns of closeness: people who are together probably have something in common.
K‑means does exactly that, but with math instead of intuition.
The intuition: «centers» that attract points
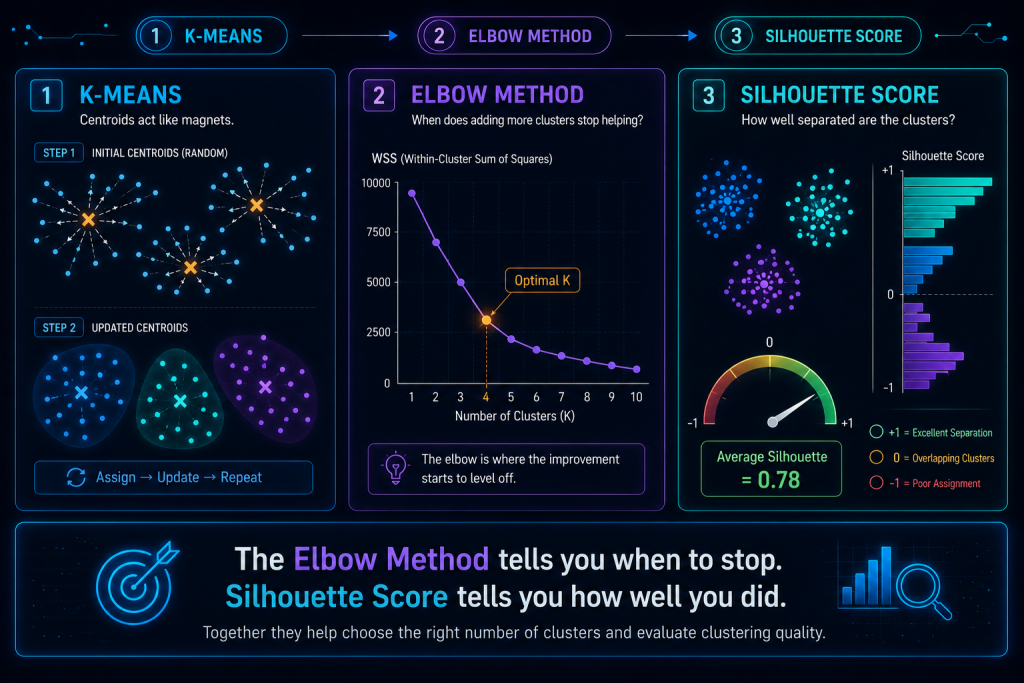
K‑means works on a surprisingly simple idea. Think of the centroids as magnets:
- You choose K groups (K is a number you decide; say, 3).
- You drop K magnets (centroids) at random positions on the plane.
- Each customer sticks to the nearest magnet.
- Each magnet repositions itself at the center of all the points it attracted.
- You repeat steps 3 and 4 until the magnets stop moving.
That «stop moving» is the key: when the centers no longer shift from one round to the next, it means the groups have stabilized and the algorithm is done.
In our store, after a few iterations, one magnet would settle over the «high spending, frequent buyer» zone, another over «low spending, occasional buyer,» and another somewhere in between. Nobody told it to. It found them on its own.
The problem: how many groups do I pick?
And here comes the awkward question, the one that keeps everyone up at night the first time they use K‑means:
«How many groups should I use? 3? 5? 10?»
K‑means won’t tell you. You have to decide K before you start. And it’s a bit absurd: we ask it to discover the hidden structure of the data… but first we have to tell it how many groups we expect to find.
Getting it wrong has real consequences:
- If you pick too few groups, you blend different profiles together: your VIP customers end up in the same bucket as the bargain hunters, and the segmentation is useless.
- If you pick too many, you fragment groups that should stay together: you split your loyal customers into five artificial subgroups that mean nothing.
Luckily, we’re not helpless. We have two tools that help us choose well: the Elbow method and the Silhouette score.
Elbow Method — hunting for the «elbow»
The elbow method looks at how much the model improves as you add groups.
The idea is simple. For each K (2, 3, 4, 5…) you compute the WSS (Within-Cluster Sum of Squares), a measure of how compact the groups are: how tightly the points huddle around their center. The smaller the WSS, the more snugly they’re packed together.
The tricky part is that the more groups you add, the smaller the WSS will always get. At the absurd extreme, if you make as many groups as there are customers, each one is its own group and the WSS is zero. Perfect… and useless. So you can’t just pick «the one with the lowest WSS,» because the biggest number would always win.
The trick is to look at the shape of the curve. It drops sharply at the start (going from 2 to 3 groups improves things a lot) and then, suddenly, it flattens out: adding more groups barely helps anymore.
That point where the curve «bends» and goes from a steep drop to nearly flat is the elbow. And that’s usually your magic number of groups.
It’s like deciding how many boxes to use to organize your storage room: going from one box to three changes your life, but going from box number twelve to thirteen… it makes no difference, you’re not organizing anything new. The elbow is exactly that moment where one more box stops being worth it.
Silhouette Score — how well separated are the groups?
The Silhouette is more elegant than the elbow, because it measures something the Elbow misses. It’s not enough for the groups to be compact on the inside; it also wants them to be well separated from each other.
For each point, it asks two questions:
- a → how close am I to the members of my own group? (my fellow clustermates)
- b → how close am I to the nearest neighboring group? (the cluster next door)
And it combines the two into a formula that compares those distances:
The result ranges from –1 to 1, and reads like this:
- 1 → perfect: you’re snugly tucked in with your own and miles away from the rest.
- 0 → you’re on the border: halfway between two groups, you could fall into either one.
- –1 → badly assigned: you’re actually closer to the group next door than to your own. Something went wrong.
In the end, you average the Silhouette of every point and get a global score for your clustering. In practice it’s like going customer by customer and asking each one: «do you feel like you’re in the right group, or would you rather be in the one next door?» If most of them answer «I’m good here,» your segmentation makes sense.
K‑means + Elbow + Silhouette: the full workflow
Putting the three pieces together, the real working process looks like this:
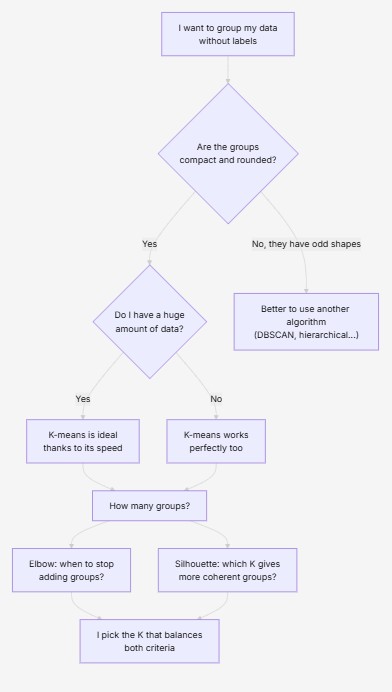
- You try several values of K (2, 3, 4, 5…) and train a K‑means with each one.
- You look at the Elbow to see the K beyond which compactness stops improving.
- You look at the Silhouette to see which K produces the most coherent and well-separated groups.
- You choose the K that balances both criteria (they often agree; when they don’t, you decide using business context).
The nice way to remember it:
The Elbow tells you when to stop. The Silhouette tells you how well you did.
One looks at efficiency (is it worth adding more groups?), the other looks at quality (are the groups I have actually well made?).
Pros and cons of K‑means
No tool is magic, and K‑means has a very distinct personality: it shines in some scenarios and sinks in others. It’s worth being clear about that before you unleash it on your data.
| ✅ Pros | ❌ Cons |
|---|---|
| Fast and efficient, even with huge amounts of data | You have to pick K by hand (that’s why we use Elbow and Silhouette) |
| Easy to understand and explain to anyone | Fails when groups have odd shapes (not round) |
| Works great when groups are compact and separated | It’s sensitive to outliers (a single outlier drags the centroid off) |
| Perfect for customer segmentation, grouping products, or spotting behavioral patterns | Depends on the initial position of the centroids (two runs can give different results) |
On that last drawback, there’s a practical trick you’ll see a lot: run the algorithm several times with different starting points and keep the best result. Most libraries do this for you automatically.
When to use K‑means and when not to
To keep you from going wrong, here’s the visual summary of when K‑means is your friend and when you should look toward another algorithm:
In summary
- K‑means groups unlabeled data by looking for «centers» (centroids) that act like magnets and attract similar points.
- Its big catch is that you have to decide the number of groups (K) before you start.
- The Elbow helps you choose how many groups to use: it finds the point where adding more stops being worth it.
- The Silhouette tells you whether those groups are well formed and well separated, point by point.
- Together they make a solid, reliable workflow for clustering in real-world problems.
And the image to hold onto: if supervised learning was like grading exams with the answer key in front of you, clustering is like organizing a storage room in the dark without knowing what’s inside. K‑means decides where to put each thing, the Elbow tells you how many boxes you need, and the Silhouette confirms whether the organization ends up making sense, or whether you’ve stashed the tennis rackets in with the dishes.