





Dimensionality Reduction: LDA
The algorithm that separates universes
How to find the directions that best tell classes apart, right when PCA falls short.
In the last chapter we met PCA, the algorithm that flattens the universe by looking for the directions where the data varies most. It’s a brilliant tool, but it has a blind spot worth understanding before we move on: PCA knows nothing about classes. It has no idea who’s who.
And this, which sounds like a technical detail, is actually a huge limitation.
If you have loyal and occasional customers, PCA doesn’t care: it won’t try to separate them. If you have photos of cats and dogs, PCA won’t try to distinguish them. If you have fraudulent and normal transactions, it makes no effort to push them apart. PCA chases exactly one thing: variation. It looks for where the data has the most «life,» without ever asking which group each point belongs to.
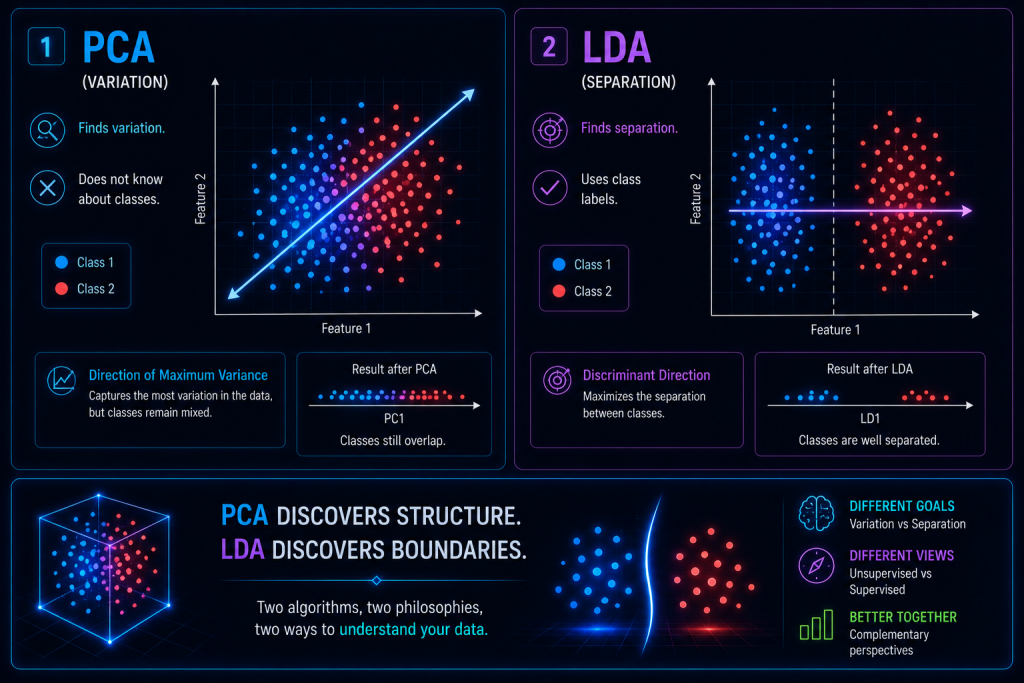
And here’s the trap: variation doesn’t always mean separation. The direction where your data spreads out the most might be precisely the one that blends your two groups into a single mush. PCA would happily flatten them together, because to it they’re just points.
That’s where LDA comes in, with a completely different philosophy.
What is LDA?
LDA stands for Linear Discriminant Analysis, and its mission is nothing like PCA’s. Where PCA asks:
«Where does the data vary the most?»
LDA asks:
«Where do the classes separate best?»
It’s not a subtle difference. It’s a total shift in mindset. PCA works blind, without labels, exploring the shape of the dataset. LDA works with the answers in front of it: it knows which point is a loyal customer and which is an occasional one, and it uses that information to find the angle from which both groups look as far apart as possible.
That’s why we say PCA is unsupervised and LDA is supervised. One improvises without sheet music; the other has the solution and looks for the best way to draw it.
The intuition: separating clouds
Picture two clouds of points floating in a 50-dimensional space. One blue cloud is your loyal customers; a red one, the occasional ones. There they are, tangled up in a space impossible to visualize.
PCA would look for the direction along which both clouds, taken as a whole, stretch out the most. The problem is that this direction might run lengthwise through both clouds, leaving them overlapped. You’d have reduced dimensions, sure, but you still couldn’t tell one group from the other.
LDA does exactly the opposite. It looks for the direction that achieves two things at once:
- Keep the centers of the two clouds as far apart as possible from each other.
- Keep the points within each cloud as tight as possible inside their own group.
It’s like searching for the perfect line to split two groups on a chart: that one line that leaves the blues on one side, the reds on the other, with as little mixing at the border as possible.
The math idea, painlessly
All of LDA boils down to optimizing a single ratio, a quotient between two competing ideas:
Think of it as a scale. On top, what you want to maximize: the distance between the class centers (keep them far). On the bottom, what you want to minimize: how scattered the points are within each class (keep them compact).
LDA looks for the direction that makes this ratio as large as possible. Numerator up, denominator down: distant classes and tight groups. When it finds that direction, it has found the angle from which your groups stand apart better than from any other.
What does LDA produce?
Here’s a curious and very practical difference from PCA. LDA generates what we call discriminant components, but it can’t produce as many as it likes. The number is capped by how many classes you have:
- 2 classes → LDA produces 1 component
- 3 classes → LDA produces 2 components
- k classes → LDA produces k − 1 components
The rule is simple and has no exceptions: LDA can never give you more components than the number of classes minus one. It makes sense if you think about it: to separate two groups a single line is enough; to separate three, you need a plane defined by two directions. The geometry of separation sets the limit.
PCA vs LDA: the comparison everyone needs
Placed side by side, the differences jump out at once:
| Feature | PCA | LDA |
|---|---|---|
| Type | Unsupervised | Supervised |
| Goal | Maximum variation | Maximum separation |
| Uses labels | No | Yes |
| Components | Up to n variables | Up to k − 1 classes |
| Best for | Exploration | Classification |
And if you had to sum it up in a single sentence you’ll never forget:
PCA discovers structure. LDA discovers boundaries.
Example in our store
Let’s get concrete again. Imagine you classify your customers into three groups: loyal, occasional, and dormant. And you describe each one with 40 variables: spending, frequency, visits, clicks, time on site, and a long list more.
If you apply PCA, you get 40 components, of which the first 2 or 3 capture most of the variation. Useful for exploring, but with no guarantee that those axes separate your three customer types.
If you apply LDA, on the other hand, you get only 2 components (because you have 3 classes, and 3 − 1 = 2). But those two components aren’t just anything: they’re optimized precisely to separate:
- loyal ↔ occasional
- loyal ↔ dormant
- occasional ↔ dormant
When you plot the LDA chart in 2D, the three groups appear cleanly separated, each in its own zone. Something PCA, no matter how good it is, can never guarantee, because it didn’t even know those groups existed.
What is LDA good for in real life?
Its natural home is anything to do with classifying. It works as an excellent preparatory step before training models like SVM, logistic regression, KNN, decision trees, or small neural networks: by keeping only the directions that separate classes, you hand the model a much cleaner problem.
It’s also ideal for supervised visualization, when you actually want to see how your classes separate on a 2D plane. And it works very well as dimensionality reduction with labels: when you have tons of variables but also know which group each sample belongs to. As a bonus, by discarding irrelevant directions and keeping only the discriminating ones, it reduces noise and helps prevent overfitting.
Advantages and disadvantages
Like any tool, LDA shines at some things and stumbles at others.
| Advantages | Disadvantages |
|---|---|
| Leverages class information | Only works if the classes are more or less separated |
| Produces highly interpretable components | Assumes the classes have a similar (Gaussian) distribution |
| Excellent for classification | Doesn’t work well if the classes are non-linear |
| Reduces dimensions optimally for separation | Useless for clustering: it needs labels, no exceptions |
| Very fast and stable | Limited to k − 1 components |
When to use LDA (and when not to)
Use it when you have labels, you want to separate classes, you need to visualize those groups in 2D, you’re trying to improve a classification model, or you have many variables and few samples.
Avoid it when you don’t have labels (without them, LDA simply can’t work), when the classes overlap too much, when the boundaries between groups are curved or complex (LDA only understands straight lines, just like PCA), or when you need more components than the k − 1 rule allows.
In summary
LDA is the algorithm that separates clouds. It finds boundaries where PCA saw only points, compresses dimensions without ever losing track of who’s who, and uses the labels to discover the directions that truly tell one group from another. It turns data that’s impossible to look at into charts where the classes finally appear clearly separated.
If PCA was about discovering dimensions, LDA is about discovering separations.
It’s the algorithm that looks at your classes, rolls up its sleeves, and says:
«Let me find the direction where they’re farthest apart.»