


Data Preparation and Exploratory Data Analysis (EDA) in Machine Learning
Most Machine Learning projects don’t fail because of the model — they fail because the data was never properly understood.
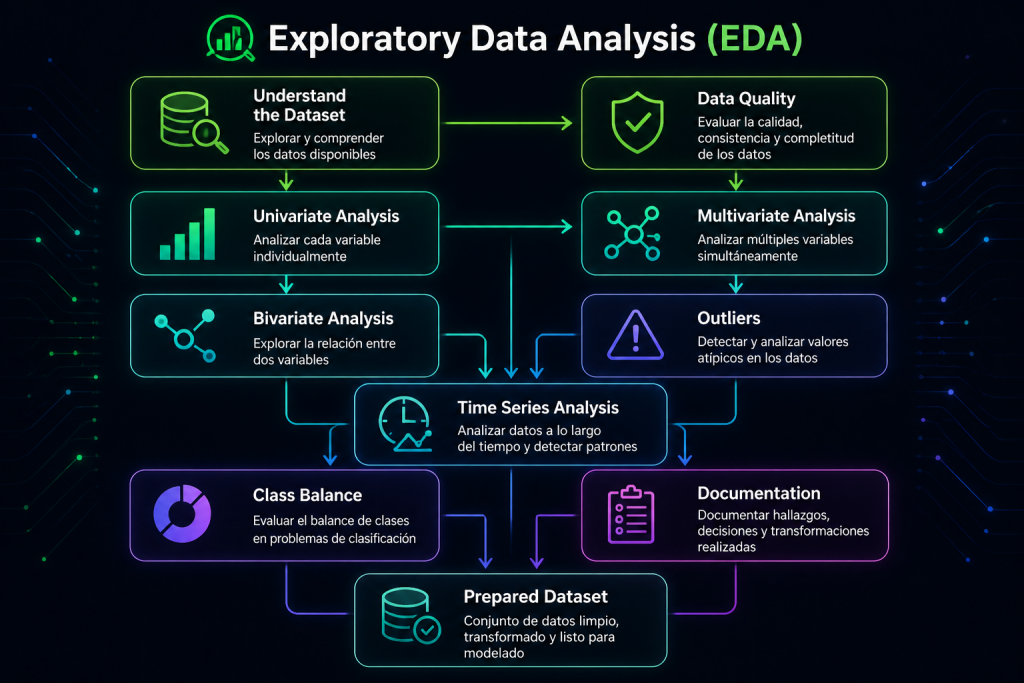
Once the problem is clearly defined and the project goals are well established, the next critical step in any Machine Learning workflow is data preparation and exploration, commonly known as Exploratory Data Analysis (EDA).
EDA is the stage where you start to truly understand the raw material of the model. It is not just about checking columns or generating charts. It is about discovering what the dataset contains, what problems it may have, what patterns appear, and what decisions need to be made before training any algorithm.
In practice, a strong EDA often makes the difference between a robust project and one that is full of issues that are difficult to fix later on. It does not only improve model performance; it also helps avoid bias, data leakage, misleading conclusions, and production failures.
1. What is EDA and why is it so important?
Exploratory Data Analysis is the process of analyzing, cleaning, transforming, and understanding data before training a Machine Learning model.
Its purpose is not only descriptive. EDA is meant to answer key questions such as:
- What structure does the dataset have?
- How complete and reliable is the data?
- Are there useful relationships between variables?
- Are there anomalies, errors, or extreme values?
- Is the target variable balanced or skewed?
- Is there any sign of data leakage?
A model is only as good as the data it receives. That is why a well-executed EDA helps uncover problems before they become expensive mistakes.
Without this stage, it is easy to build models that:
- learn noise instead of real patterns,
- produce misleading metrics,
- fail when exposed to new data,
- or make predictions based on incomplete or incorrect information.
2. Understanding the dataset: structure and content
The first step in EDA is understanding what kind of data you have and how it is organized.
Before making any transformations, it is worth reviewing:
- number of rows and columns,
- variable types: numerical, categorical, date/time, text, or identifiers,
- presence of duplicates,
- missing values,
- cardinality of categorical variables,
- range, spread, and distribution of numerical variables.
At this stage, it is also important to ask business and domain questions:
- Does the data actually represent the problem we want to solve?
- Is the sample large enough to train a reliable model?
- Is there any obvious bias in how the data was collected?
- Do the variables make sense from an operational or business perspective?
This initial analysis helps identify structural issues that could later affect the entire pipeline.
3. Data quality: the silent enemy
In many Machine Learning projects, the main problem is not the model itself, but the quality of the data.
Real-world datasets often contain imperfections such as:
- missing values,
- duplicate records,
- inconsistent formats,
- capture errors,
- extreme outliers,
- columns with very low variability,
- variables with too many unique values,
- incorrectly formatted dates,
- or even data leakage.
One of the most dangerous problems is data leakage, which happens when the model has access, directly or indirectly, to information that would not be available at prediction time. This can artificially inflate performance during training, while causing the model to fail in production.
Common strategies to handle these issues include:
- imputing missing values using mean, median, mode, or more advanced models,
- removing rows or columns depending on the severity of the issue,
- normalizing or standardizing variables,
- correcting formatting problems,
- treating outliers through capping or winsorization,
- reviewing time-based splits to avoid leakage.
The right approach depends on the variable type, the amount of affected data, and the impact the issue has on the model objective.
4. Univariate, bivariate, and multivariate analysis
EDA is not limited to looking at each variable on its own. It also involves studying how variables relate to one another.
Univariate analysis
Univariate analysis examines one variable at a time.
It is used to understand:
- the shape of the distribution,
- the spread,
- the presence of extreme values,
- the frequency of categories,
- and the overall behavior of each feature.
Useful visualizations include:
- histograms,
- boxplots,
- bar charts,
- density plots.
This step helps detect variables with unusual distributions, strong skewness, or low variance.
Bivariate analysis
Bivariate analysis studies the relationship between two variables.
Here, the goal is to answer questions such as:
- Which variables are related to the target?
- Are there strong correlations between variables?
- Are there meaningful differences between groups or classes?
- Does one variable partially explain the behavior of another?
Common tools include:
- scatterplots,
- cross-tabulations,
- correlation analysis,
- comparative boxplots,
- class-based distribution plots.
This level of analysis is especially useful for identifying predictive, redundant, or weakly informative variables.
Multivariate analysis
Multivariate analysis looks at the interaction between several variables at once.
It helps uncover:
- complex patterns,
- redundancies between features,
- non-linear relationships,
- natural groupings,
- hidden structures in the data.
Common techniques include:
- correlation matrices,
- heatmaps,
- PCA,
- exploratory clustering,
- pair plots.
This step becomes especially useful when the dataset has many variables and you need to understand how they interact before moving into feature engineering.
5. Detecting outliers and anomalies
Outliers are observations that differ significantly from the rest of the data. They are not always errors, but they always deserve attention.
They can:
- distort summary statistics such as the mean,
- affect sensitive models like linear regression, KNN, or SVM,
- indicate data capture issues or defective records,
- or reveal real and meaningful behavior.
For example, a very high value in a billing variable might be a data error, but it could also belong to a high-value customer segment that the business needs to identify.
Common methods for detecting outliers include:
- boxplots and IQR,
- z-score,
- Isolation Forest,
- DBSCAN,
- manual visual inspection of distributions.
The key decision is not only to detect the outlier, but to understand its origin:
- Is it an error that should be corrected?
- Is it an exceptional case that should be kept?
- Does it negatively affect the model?
- Should it be treated differently?
Not all outliers should be removed. In some cases, removing them may cause the model to lose valuable information.
6. Time-based analysis, when applicable
In problems with temporal data, EDA should include a specific analysis of how the data behaves over time.
This is essential in cases such as:
- forecasting,
- churn,
- fraud,
- demand prediction,
- predictive maintenance,
- anomaly detection.
In these scenarios, it is important to study:
- trends,
- seasonality,
- cycles,
- sudden changes,
- time-based anomalies,
- behavior across time windows,
- lag features.
Time-based analysis also helps detect data leakage, especially when records from different periods are mixed without respecting chronological order.
In many projects, this step is decisive in preventing models that look good in validation but fail when they face future data.
7. Class balance and target distribution
When the target variable is imbalanced, the problem changes significantly.
If one class clearly dominates the other, the model may simply learn to predict the majority class and still achieve seemingly acceptable accuracy. For this reason, accuracy is often misleading in imbalanced settings.
Instead, it is better to review metrics such as:
- precision,
- recall,
- F1-score,
- AUC-ROC,
- confusion matrix.
It may also be necessary to use techniques such as:
- oversampling,
- undersampling,
- SMOTE,
- class weighting,
- custom decision thresholds.
Analyzing the target distribution is essential to understand whether the problem has been framed correctly and whether the chosen metrics truly reflect the value of the model.
8. Documenting the EDA: a step many teams skip
A professional EDA does not end with charts. It should also leave a clear record of everything that was done.
It is a good idea to document:
- what problems were found,
- what decisions were made,
- which variables were removed and why,
- how missing values were handled,
- what risks were identified,
- what hypotheses emerged,
- what assumptions were made.
This documentation matters for several reasons:
- it improves reproducibility,
- it helps with audits,
- it supports collaboration across teams,
- it brings structure to the pipeline,
- and it is very useful in MLOps or regulated environments.
In real projects, the value of EDA is often not only in the analysis itself, but also in the clarity it provides for the next stages.
9. Practical example
Let’s consider a project aimed at predicting churn in a SaaS platform.
The dataset includes:
- 250,000 customers,
- 40 variables,
- usage information,
- billing data,
- support interactions,
- and product engagement metrics.
Findings from the EDA:
- 12% missing values in “support response time”
- 3 duplicate variables
- 1 variable with data leakage
- strong correlation between “monthly usage” and “number of tickets”
- outliers in “monthly billing”
- an imbalanced target, with 22% churn
- monthly seasonality in product usage
Decisions made:
- median imputation,
- removal of duplicates,
- removal of the leakage variable,
- winsorization of outliers,
- moderate oversampling,
- creation of time-based features.
Result: a cleaner, more consistent dataset ready for feature engineering and model development.
Conclusion
EDA is one of the most important stages in the entire Machine Learning process.
It is where real data problems are uncovered, the dataset is properly understood, and decisions are made that directly affect model performance.
A strong EDA:
- reduces errors,
- improves data quality,
- helps prevent leakage,
- reveals key patterns,
- guides feature engineering,
- accelerates development,
- and increases the chances of success in production.
Without a proper EDA, even the best model is likely to fail.
Next article
In the next post, we will explore Feature Engineering: how to transform raw data into useful variables that truly improve model performance.