





Decision Trees (ID3, C4.5, CART)
Models that classify by making decisions the way a person would
Some models learn through geometry, like K‑NN, asking «who do I resemble?». Others learn through probability, like Naive Bayes, asking «what’s most likely?». And then there are decision trees, which do something far more human: they ask questions.
Think about how you decide whether to grab an umbrella in the morning:
«Is it cloudy? Yes.
Does the phone say rain? Yes.
Then I’ll take the umbrella.»
You didn’t calculate distances or probabilities. You just chained questions together until you reached a decision. That’s literally what a decision tree is: a sequence of questions that keeps splitting the problem into clearer and clearer pieces, until it gives an answer. That’s why they’re among the easiest models to explain to someone who knows nothing about machine learning: you don’t need formulas, you need common sense.
Let’s get to it.
What is a decision tree?
A tree does three things, over and over:
- Splits the data based on a feature («is the fruit red?»).
- Creates branches according to the answers (one branch for «yes», another for «no»).
- Repeats the process on each branch until it reaches the leaves, which are the final prediction (a class or a value).
Visually it’s identical to a flowchart: you start at the top with a question and work your way down as you answer.
And here’s the whole trick: which question should you ask first? Because that first question is the one that brings the most order to the chaos. Choosing well where to start is the difference between a useful tree and one that stumbles around.
How does a tree decide which question to ask?
A good tree looks for questions that leave the groups as «pure» as possible. A pure group is one where nearly all the examples belong to the same class.
Picture a box of apples and oranges all mixed together. If you ask «is the fruit red?» and suddenly almost all the apples fall to one side and almost all the oranges to the other, you’ve asked an excellent question: you’ve created order. If you ask something that leaves both boxes just as mixed as before, that question is useless.
To measure how much order a split creates, trees use metrics. The two headliners are:
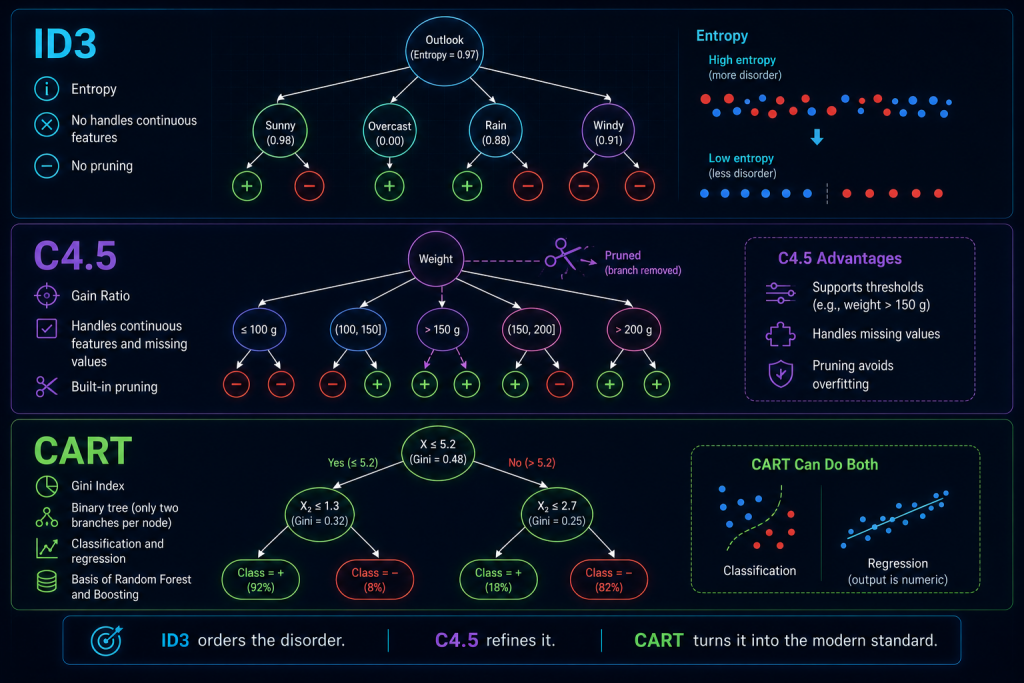
- Entropy (used in ID3 and C4.5): measures the «disorder» of a group. A group that’s all the same type has entropy 0; a fifty‑fifty group has maximum entropy.
- Gini index (used in CART): measures the probability of getting it wrong if you labeled at random. The purer the group, the lower the Gini.
From entropy you compute information gain, which is simply how much disorder we removed by asking a question. The tree tries the possible questions and keeps the one that gains the most.
An example with numbers (so it doesn’t stay abstract)
Suppose you have 10 pieces of fruit: 6 apples and 4 oranges, all jumbled up. That group is pretty disordered.
You ask «is the fruit red?» and it splits like this:
| Group | Apples | Oranges | Pure? |
|---|---|---|---|
| Red (5 pieces) | 5 | 0 | Yes, perfectly |
| Not red (5 pieces) | 1 | 4 | Almost |
Before, you had a box in complete disarray. After a single question, one side came out perfect (5 apples, 0 oranges) and the other nearly perfect. That reduction in disorder is the information gain, and it’s why the tree would pick this question over one that left the groups just as mixed. That’s the whole criterion: reward the questions that separate well.
ID3, C4.5 and CART: how do they differ?
All three build trees, but each one is a stage in the same evolutionary story.
ID3 — the pioneer
It’s the classic tree, the «original» version. It uses entropy and always picks the question that reduces disorder the most. It works, but its age shows:
- It doesn’t handle continuous values well (numbers like weight or age).
- It tends to overfit: it learns the training data in such detail that it later fails on new data.
Think of it as the prototype that proved the idea worked.
C4.5 — the natural evolution
C4.5 takes ID3 and polishes away almost all its flaws:
- It handles continuous variables by creating thresholds («is the weight over 150 g?»).
- It tolerates missing values, which are very common in real data.
- It uses normalized gain (gain ratio) so it isn’t fooled by sneaky questions that split the data into tons of tiny groups.
- It adds pruning: it trims unnecessary branches to avoid overfitting.
It’s the algorithm that took trees out of the lab and put them to work in the real world.
CART — the modern standard
CART (Classification and Regression Trees) is the one you use today, almost always without realizing it. Its key traits:
- It uses the Gini index to classify.
- It also works for regression (predicting numbers, not just categories), something ID3 and C4.5 can’t do.
- It produces binary trees: every question has exactly two branches (yes / no).
- It’s the foundation of today’s big models: Random Forest, ExtraTrees, Gradient Boosting, XGBoost, LightGBM, CatBoost… all of them are, under the hood, piles of CART trees working as a team.
The practical takeaway: if you use trees today, you’re almost certainly using CART, directly or indirectly.
| ID3 | C4.5 | CART | |
|---|---|---|---|
| Metric | Entropy | Gain ratio | Gini index |
| Continuous variables | No | Yes | Yes |
| Missing values | No | Yes | Yes |
| Regression | No | No | Yes |
| Branch type | Multiple | Multiple | Binary |
| Pruning | No | Yes | Yes |
An intuitive example: classifying fruit
Imagine you want to tell apples from oranges. A tree might learn something as readable as this:
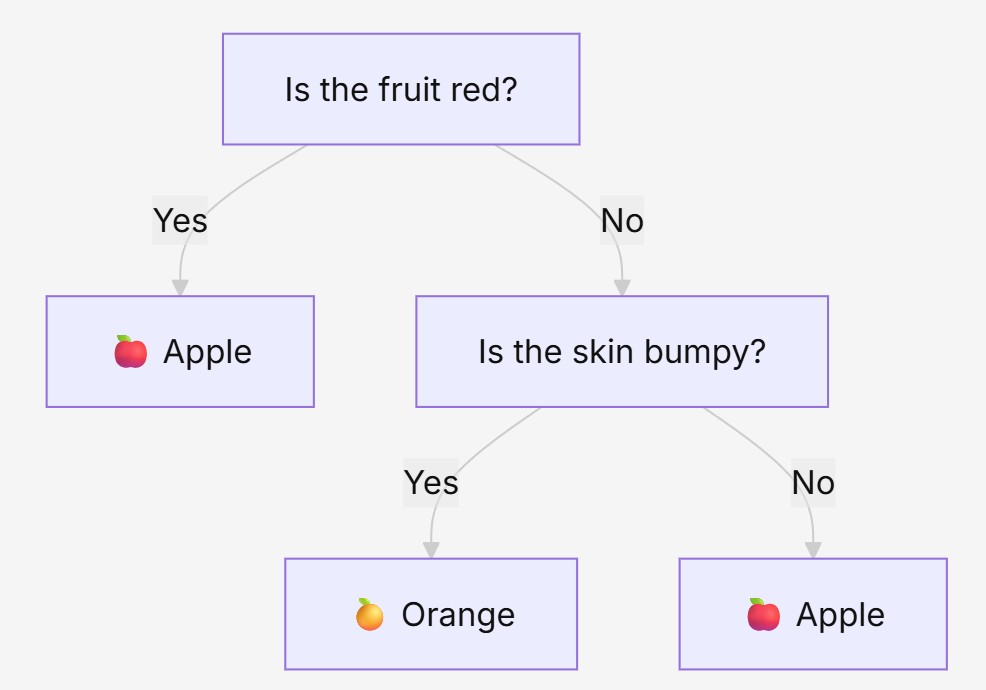
No formulas. No distances. Just chained questions that keep splitting the data. And the best part: you could explain it to your grandmother and she’d get it on the first try. That transparency is the tree’s great superpower.
Advantages of trees
- Highly interpretable: you can read the rules out loud and understand exactly why the model decided what it did. In many fields (banking, medicine) that’s worth gold.
- They handle mixed data without complaint: numeric and categorical at the same time.
- They capture interactions between variables (where combinations of factors matter together).
- They don’t need normalization: they don’t care if one variable ranges from 0 to 1 and another from 0 to 10,000.
- They’re the foundation of today’s best ensemble models.
Disadvantages
- They overfit easily if you don’t prune them: they grow so much they even learn the noise.
- Their decision boundaries are rectangular, step‑shaped, not smooth curves.
- A single tree is usually less accurate than more sophisticated models.
- They’re unstable: change a handful of data points and the tree can come out quite different.
It’s precisely because of these flaws that ensembles were born. The idea is brilliant in its simplicity: if one tree alone is unstable, why not gather hundreds of trees and have them vote? That’s the trick behind Random Forest and Gradient Boosting, which turn the weakness of a single tree into the strength of the group.
When should you use trees?
- When you need interpretability and have to explain every decision.
- When you have lots of categorical variables.
- When you want a model that’s fast to train as a starting point.
- When you’re going to use ensembles, because trees are their raw material.
In summary
- ID3: uses entropy, is simple, and tends to overfit. The pioneer.
- C4.5: improves on ID3 with continuous variables, gain ratio and pruning. The one that popularized them.
- CART: the modern standard; uses Gini, builds binary trees, and works for classification and regression. The foundation of everything used today.
- Trees split the data with questions that maximize the purity of the groups.
- They’re interpretable, flexible, and the cornerstone of today’s best ensemble models.
And if you take away just one idea: a decision tree is nothing more than the way you already make decisions, written so a machine can follow along.