





Unsupervised Learning — Association
Association Rules: the algorithm that uncovers hidden patterns in your purchases
The model that doesn’t group… but connects. It finds invisible relationships between products without anyone pointing them out.
So far, on this journey through unsupervised learning, all our algorithms shared the same obsession: grouping. K‑means looked for centers, DBSCAN looked for neighborhoods, Mean‑Shift climbed hills, and Agglomerative built family trees. Different methods, same underlying question:
«Which points resemble each other?»
Today we do something different. Today we change the question entirely:
«Which things appear together?»
Welcome to Association Rules, a type of algorithm that doesn’t draw clusters or hunt for shapes on a map. What it looks for are co‑occurrence patterns: things that tend to show up hand in hand. It’s the algorithm behind the most famous phrase in the history of data analysis:
«Customers who buy diapers also buy beer.»
And though it sounds like a dinner-table joke, that’s literally what it does: it uncovers relationships nobody labeled, nobody flagged, and nobody saw… until the algorithm brings them to light.
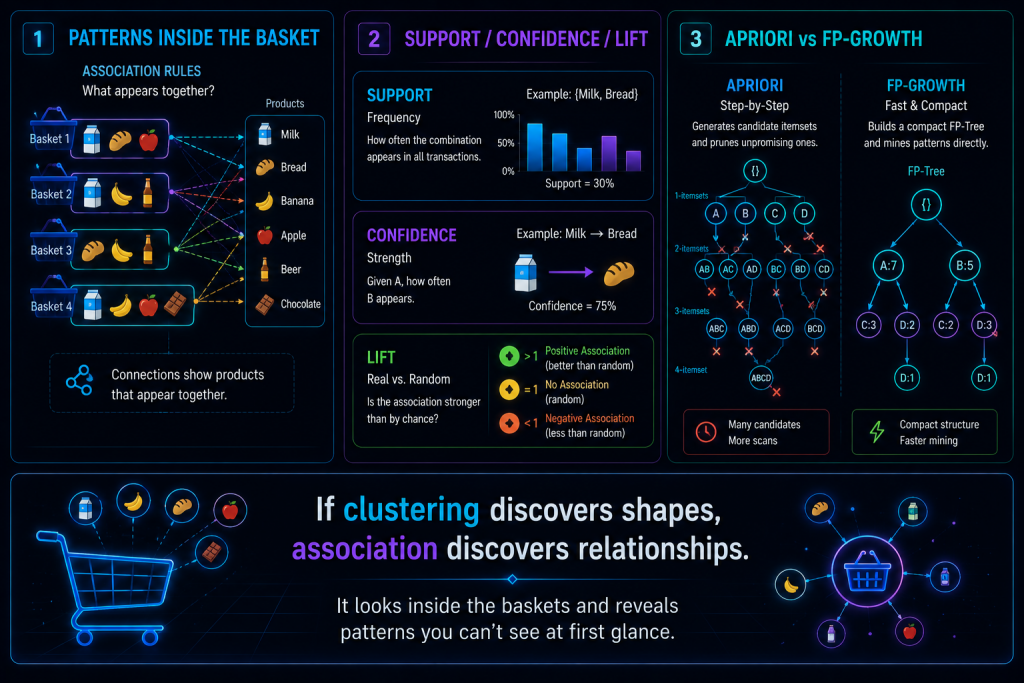
The example that goes with us
We’re still in our usual online store. But notice the shift in perspective: until now we saw customers as points on a plane, placed according to how much they spent and how often they bought. Today we stop looking at the people and start looking at what’s inside their basket.
Each customer wheels around a cart full of products:
- one buys t‑shirt + trousers + socks,
- another buys mouse + keyboard + mousepad,
- another buys shampoo + conditioner,
- another buys t‑shirt + hoodie + cap.
And you, staring at thousands of baskets, want to answer questions that are impossible at a glance: which products tend to travel together? which combinations repeat over and over? does buying one product predict buying another? are there hidden relationships that the human eye could never spot across thousands of receipts?
That’s exactly what association rules do.
What, deep down, is an association rule?
An association rule always has the same shape, almost like a saying:
If someone buys A, they usually also buy B.
For example: if they buy a t‑shirt, they also buy trousers. If they buy a mouse, they also buy a keyboard. If they buy shampoo, they also buy conditioner.
But here’s the important detail: something happening «sometimes» means nothing. A customer buying bread and light bulbs on the same day doesn’t turn that into a pattern. We need a way to measure whether the relationship is real or just chance. And for that, three metrics work as a team. Let’s meet them one by one.
Metric 1 — Support: «does this happen a lot, or is it a fluke?»
Support is the simplest metric: it measures how often a combination appears across the total number of baskets. It’s basically the popularity of the pattern.
Imagine that out of your 10,000 customers, there are 200 who buy t‑shirt + trousers. The support would be:
That is, 2% of your customers buy that combination. Support answers the question:
«Is this a frequent pattern, or an anecdote that only happened four times?»
If the support is very low, the pattern may not even be worth your attention.
Metric 2 — Confidence: «how strong is the relationship?»
Support tells you whether something is popular, but not whether A pulls B along with it. That’s what confidence is for: it measures how often buying A leads to buying B.
Let’s stick with the example. Suppose 200 customers buy t‑shirt + trousers, but 250 customers buy a t‑shirt (with or without trousers). The confidence of the rule t‑shirt → trousers would be:
Translated: 80% of those who buy a t‑shirt also grab the trousers. Confidence answers:
«When someone buys A, how likely are they to buy B?»
It’s a powerful metric… but it has a trap that the next metric comes to solve.
Metric 3 — Lift: «is it a real relationship or just coincidence?»
Here comes the most elegant of the three. The problem with confidence is that some products sell so much they seem related to everything. If almost everyone buys trousers, of course they’ll show up next to the t‑shirt… but also next to anything else. That’s not a special relationship, it’s just that trousers are a bestseller.
Lift corrects exactly that: it compares the real confidence with the probability that B would be bought by pure chance. Its reading is dead simple:
- lift > 1 → A and B are genuinely related (they appear together more than expected),
- lift = 1 → A and B are independent, they have nothing to do with each other,
- lift < 1 → A and B repel each other, buying one makes buying the other less likely.
Lift answers the definitive question:
«Is this relationship real, or just a statistical coincidence dressed up as a pattern?»
The three metrics together form a perfect little team: support filters what’s frequent, confidence measures the strength, and lift confirms whether it’s authentic.
And how does the algorithm find all these rules?
Searching for combinations by hand would be impossible: with just a few hundred products, the number of possible combinations shoots up into the millions. That’s why there are algorithms to do the heavy lifting. There are two main players:
1. Apriori. It’s the classic, very intuitive method. It grows step by step: first it looks at individual products, then pairs, then trios, then quartets… and at each level it ruthlessly discards anything that doesn’t reach a minimum support. Its clever idea: if a pair of products is already infrequent, any combination that includes them will be even more so, so it’s not even worth looking at. That lets it prune the tree of possibilities instead of getting lost in infinity.
2. FP‑Growth. It’s the modern, faster sibling. Instead of testing combinations one by one, it builds a compact tree (the FP‑tree) that summarizes all the baskets at once. On top of that structure it finds frequent patterns much faster and with less effort, especially when you have tons of transactions.
Both end up in the same place: generating rules of the form A → B, each with its support, confidence, and lift.
Back to our store
Imagine we unleash the algorithm on our store’s baskets and it hands us back this rule:
t‑shirt → trousers
support = 0.12 · confidence = 0.78 · lift = 1.4
How do we read this in plain English?
- 12% of your customers buy both products (it’s a frequent pattern, not a rarity).
- 78% of those who buy a t‑shirt also take the trousers (the relationship is strong).
- And with a lift of 1.4, that relationship is 40% more likely than it would be by pure chance (it’s real, not coincidence).
Result: a frequent, strong, and authentic rule. In other words, a rule you can act on first thing tomorrow.
And what’s all this good for in real life?
This is where association rules go from mathematical curiosity to money-making machine. They’re the silent foundation behind a bunch of things you see every day:
- 🛒 Product recommendations → that «customers who bought this also bought…» that pops up right before you pay.
- 🔗 Cross‑selling → «since you’re taking this, you might want that.»
- 📦 Designing packs and bundles → the classic «shampoo + conditioner pack» at a combined price.
- 🏬 Inventory and placement optimization → if two products sell together, you put them close (physically in a store, or on the same screen in e‑commerce).
- 🎯 Personalized marketing → «you bought A, here’s a coupon for B.»
Advantages and disadvantages
Like everything in machine learning, it’s not magic: it shines on its own turf and struggles off it.
| ✅ Advantages | ❌ Disadvantages |
|---|---|
| No labels or prepared data needed | Can generate too many rules and overwhelm you |
| Uncovers relationships invisible to the human eye | You have to filter well by support and confidence |
| Ideal for retail, e‑commerce, and marketing | Doesn’t work well if the data is very sparse |
| Very easy to interpret | Detects correlation, not causation |
| Directly actionable in business | A high lift doesn’t mean A causes B |
That last point deserves a warning: association rules tell you that two things go together, not that one causes the other. Beer doesn’t make you buy diapers. They simply show up in the same basket for reasons the algorithm neither knows nor cares about.
When to use (and when not to use) association rules
So you don’t get confused, here’s the visual summary of when it makes sense to pull this tool out of the box:
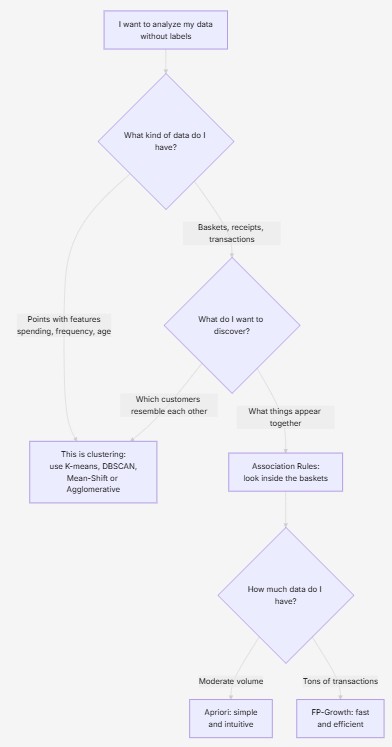
In short: use them when you have shopping baskets or transactional data, you want to discover which items combine, you need recommendations, or you’re after co‑occurrence patterns. And don’t use them when your data isn’t transactional, there are no items that «co‑occur,» or when what you’re really after are groups of similar customers (that’s clustering, and for that you already have your four earlier algorithms).
In summary
Association rules don’t group: they connect. That’s the mindset shift of this chapter.
- K‑means looked for centers, DBSCAN for neighborhoods, Mean‑Shift climbed hills, and Agglomerative built trees. They all asked «what resembles what?».
- Association rules ask something else: «what shows up together?». Their shape is always the same: if someone buys A, they usually also buy B.
- And to know whether that rule is worth it, three metrics work together: support tells you if the pattern is frequent, confidence tells you if the relationship is strong, and lift tells you if it’s real or just a coincidence.
And the image to remember it by: if clustering was about discovering shapes on a map of data, association is about discovering relationships inside the baskets. It’s the algorithm that opens the shopping cart, looks at what’s inside, and whispers the invisible connections that were there all along, waiting for someone to see them.