





Unsupervised Learning — Clustering
Mean‑Shift + Agglomerative: two algorithms that don’t look for centers
One chases mountains of density. The other builds family trees out of your data. And neither one asks you how many groups you want.
So far we’ve walked through three ways of grouping data, and each had its own obsession. K‑means looked for centers, reference points to organize everything around. DBSCAN looked for density, zones where the data packed tightly together. And the combo of K‑means + Elbow + Silhouette looked for balance, a way to nail the number of groups without flying blind.
Today we meet two algorithms that think differently, so differently they almost seem like philosophers:
- Mean‑Shift, which chases densities as if they were mountains, with every point acting like a hiker climbing toward the summit.
- Agglomerative, which builds clusters the way you’d assemble a family tree, pairing up cousins, then families, then entire clans.
They’re two approaches that stretch your intuition about how a model can discover structure without anyone handing it labels.
The example that comes along with us
We’re sticking with the same online store from the previous chapters. You’ve got thousands of customers, and for each one you know two things: how much they spend per month and how often they buy.
But this time what interests us isn’t just separating the groups, it’s understanding the terrain of your customers. Because if you plot all your buyers on a map, you won’t see a flat, uniform cloud: you’ll see crowded zones and nearly empty ones, like a mountain range seen from above. There’s a huge mountain of loyal buyers, a hill of occasional shoppers, a remote peak of premium customers… and the odd customer lost in the middle of the valley.
Mean‑Shift and Agglomerative are going to read that map in two completely different ways. Let’s start with the first.
Mean‑Shift — the algorithm that climbs mountains
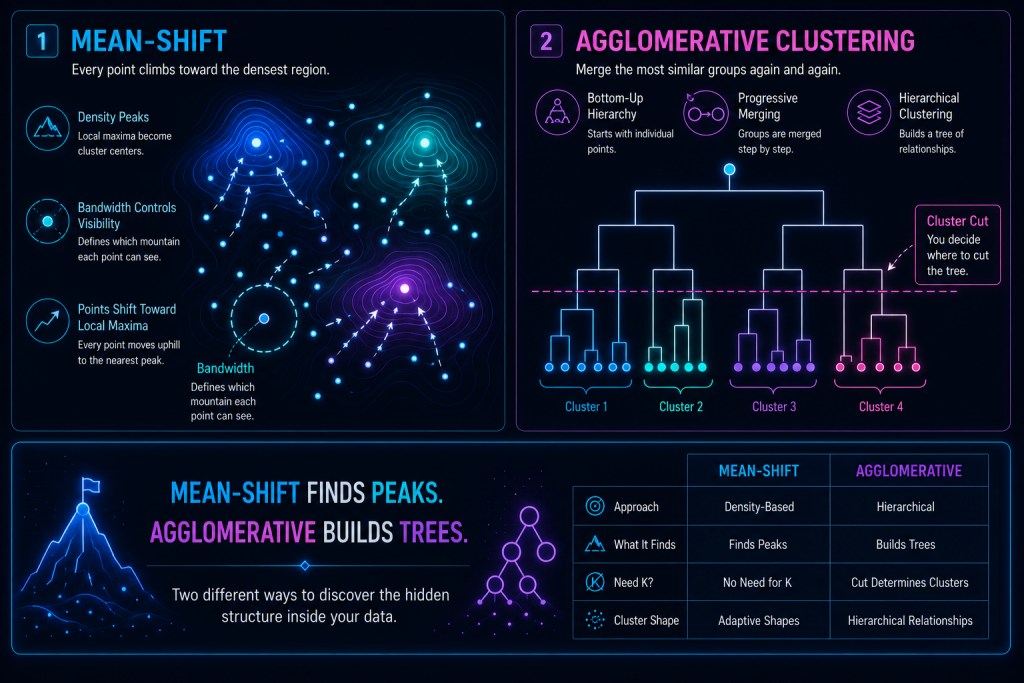
Picture that map of your customers full of mountains and valleys. Every point in your data sits somewhere on the terrain. And Mean‑Shift does something very curious: it looks for the summits.
It doesn’t look for predefined centers like K‑means. It doesn’t measure density with fixed radii like DBSCAN. It doesn’t need you to tell it how many groups there are. Mean‑Shift looks for peaks of density, and to find them it turns every point into a hiker climbing, step by step, the nearest mountain.
The intuition: “climb” toward the densest point
The process is surprisingly human. Each point looks around within a radius (the famous bandwidth) and works out which direction has the most neighbors, that is, where the terrain «rises.» Then it moves that way. And it looks again. And it moves again. Once more. And again. Until it reaches a spot from which it can no longer climb higher in any direction.
That final spot is a mode of density, a summit. And here’s the beautiful part: every hiker who ends up climbing the same summit forms a cluster. There’s nothing to decide in advance: the number of groups is simply the number of summits that appear.
The key parameter: the bandwidth
Mean‑Shift’s entire behavior hangs on a single number, the bandwidth, which answers the question «how far does each hiker look before deciding which way to climb?». And the balance changes everything:
- if the bandwidth is very small → each hiker only sees what’s right at their feet, so tons of tiny summits appear and you end up with too many clusters,
- if the bandwidth is very large → everyone sees the same giant mountain in the distance and climbs toward it, so everything merges into a single huge cluster.
Getting the bandwidth right is basically the whole job with Mean‑Shift, just as gettingepsright was with DBSCAN.
In our store
If your customers form several «mountains» of behavior (the loyal buyers packed into one zone, the occasional shoppers in another, the bargain hunters in another, and the odd isolated premium customer on their own peak), Mean‑Shift detects them without you telling it how many there are. You just release the hikers and watch how many distinct summits they end up on.
Agglomerative — the algorithm that builds trees
If Mean‑Shift is a hiker, Agglomerative is a genealogist. It doesn’t look for density, or centers, or peaks. What Agglomerative builds are hierarchies.
The intuition: start small and keep merging
The method is almost stubbornly simple. It begins by treating every customer as their own cluster, a group of one. Then it finds the two most similar clusters and merges them. And repeats. And repeats. And repeats. The two closest ones, merged. Again the two closest ones, merged.
Little by little, the small groups fuse into medium groups, the medium ones into large ones, and the large ones into a single one, until absolutely all your customers are joined in one big tree. That tree is called a dendrogram.
And here’s the trick: you decide at what height to cut the tree. Cut high and you’re left with a few very large groups; cut low and you get many small, detailed groups. The cut distance is your only real parameter.
Why this is so useful
Because it doesn’t give you a single answer, it gives you all of them at once. In one chart you can see the segmentation with few clusters, with many, with large groups, with small groups, and with every level in between. It’s like having an infinite zoom over the structure of your data: you zoom in or out until you find the level of detail you care about.
In our store
Agglomerative would show you the story step by step: first the nearly identical customers merge (two who spend the same and buy the same), then those pairs form little neighborhoods, then the neighborhoods form zones, and in the end everything converges into a single tree. You look at the dendrogram and choose: «here, at this point, I have four segments that make sense for my business.»
Mean‑Shift vs Agglomerative: two philosophies
Seeing them side by side makes it crystal clear how differently each one thinks:
| Concept | Mean‑Shift | Agglomerative |
|---|---|---|
| Do you have to tell it how many groups? | No, it discovers them on its own | No, you choose where to cut the tree |
| What does it look for? | Peaks of density (summits) | Hierarchies (a tree of similarity) |
| How does it group? | Each point «climbs» toward the densest zone | Merges the two most similar clusters, over and over |
| Detects odd shapes? | Yes | Yes |
| Detects outliers? | Sometimes | Not directly |
| Key parameter | Bandwidth (radius of vision) | Dendrogram cut distance |
| Gift it leaves you | The natural groups | A complete map of every possible segmentation |
Pros and cons
As always in machine learning, neither one is magic. Each shines on its own turf and struggles off it.
Mean‑Shift
| ✅ Pros | ❌ Cons |
|---|---|
| You don’t need to choose the number of groups | Choosing the bandwidth is hard and comes down to trial and error |
| Detects complex shapes | Scales poorly with lots of data |
| Very intuitive if you think in terms of density | Can create too many clusters if the bandwidth is small |
| Finds the natural «peaks» of the terrain | A single bandwidth doesn’t work if some zones are very dense and others very sparse |
Agglomerative
| ✅ Pros | ❌ Cons |
|---|---|
| You don’t need to choose the number of groups upfront | Costly on large datasets |
| The dendrogram is hugely informative | Doesn’t detect noise on its own |
| Works well with oddly shaped clusters | Choosing the cut point can be subjective |
| Lets you explore the segmentation at different levels | Once it merges two groups, it can’t undo the decision |
When to use each one?
So you don’t get tangled up, here’s the visual summary of which algorithm to reach for depending on what you’re dealing with:
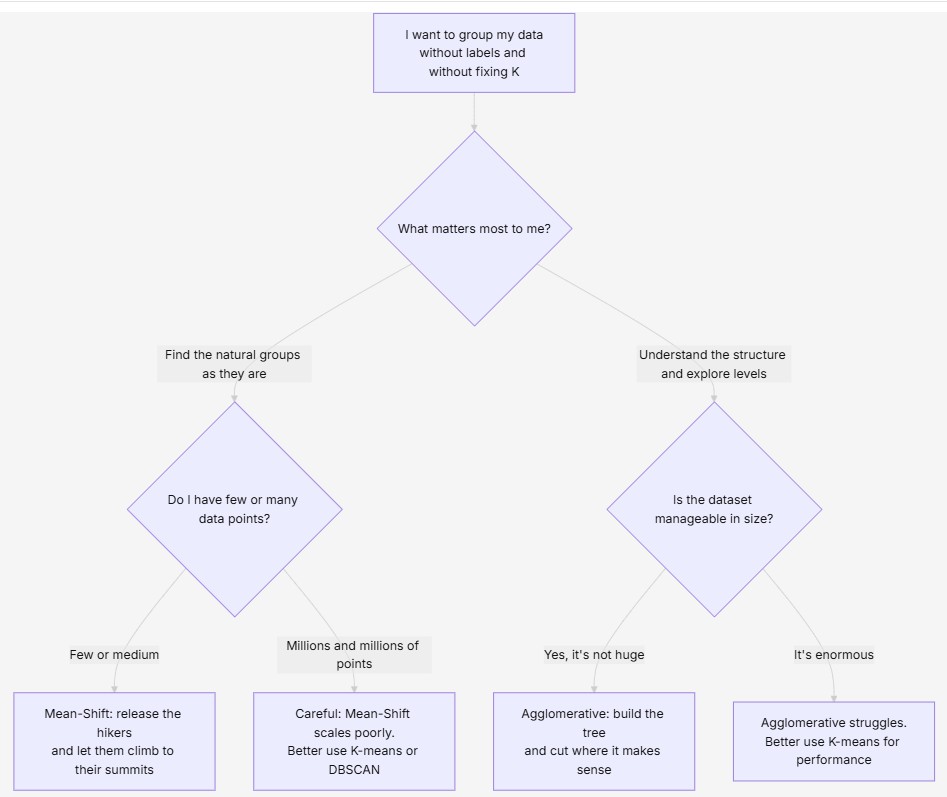
In short, Mean‑Shift is your ally when your data has clear «mountains» of density, you don’t know how many groups there are, you want to detect complex shapes, and computational cost isn’t a problem. And Agglomerative is your ally when you want to understand the hierarchical structure of your data, you need a dendrogram, you want to explore different levels of segmentation, and your dataset isn’t gigantic.
In summary
- Mean‑Shift groups by making every point «climb» toward the densest zone; each summit is a cluster and the number of groups comes out on its own.
- It depends on a single parameter, the bandwidth, and getting it right is almost the whole job.
- Agglomerative starts with each point as its own group and keeps merging the most similar ones until it forms a dendrogram, a tree you cut at whatever height you like.
- Its great gift is that it doesn’t give you one answer, it gives you all of them: you can view the segmentation at any level of detail.
And the image to remember them by: if K‑means was like tidying a storage room by putting things into boxes, and DBSCAN like walking through a city discovering its neighborhoods, then Mean‑Shift is like climbing mountains in search of each summit, and Agglomerative is like building a family tree by pairing up relatives until you reach the whole family. Each reveals a different face of your data. And together they give you a complete view of the world of clustering.